
1. Cấu trúc bài viết mẫu cho Pie Chart
Một bài IELTS Writing Task 1 nên có 4 phần rõ ràng:
-
Introduction (Mở bài)
-
Overview (Tổng quan)
-
Body 1 (Chi tiết 1)
-
Body 2 (Chi tiết 2)
🔹 Bước 1: Introduction (Mở bài)
-
Mục tiêu: Paraphrase đề bài.
-
Cách làm: dùng từ đồng nghĩa, đổi cấu trúc câu.
-
Ví dụ đề: The pie charts show the percentage of household spending in five categories in 2000 and 2020.
-
Introduction mẫu: The two pie charts compare how household expenditures were distributed across five categories in the years 2000 and 2020.
🔹 Bước 2: Overview (Tổng quan)
-
Mục tiêu: Nêu 2–3 đặc điểm nổi bật nhất.
-
Cách làm: không nêu số liệu cụ thể, tập trung xu hướng chính.
-
Overview mẫu: Overall, food and transport made up the largest proportions in both years, while entertainment and others accounted for the smallest shares. Noticeable shifts in spending patterns were also observed over the two decades.
🔹 Bước 3: Body 1
-
Mục tiêu: mô tả chi tiết những hạng mục nổi bật nhất.
-
Ví dụ:
In 2000, the largest share of household expenditure went to food, accounting for 30%, followed by transport at 25%. However, by 2020, transport spending had increased to 35%, surpassing food, which dropped slightly to 28%.
🔹 Bước 4: Body 2
-
Mục tiêu: mô tả phần còn lại, nhấn mạnh thay đổi hoặc sự ổn định.
-
Ví dụ:
Rent remained relatively stable, at around 20% in both years. Entertainment showed a modest rise from 10% to 12%, while other expenses declined from 15% to 9%.
2. Từ vựng và cấu trúc miêu tả Pie Chart
🔹 Động từ miêu tả thay đổi
-
Tăng: increase, rise, grow
-
Giảm: decrease, decline, drop
-
Ổn định: remain stable, stay the same
-
Thay đổi nhỏ: fluctuate, vary slightly
🔹 Cấu trúc hữu ích
-
The proportion of … rose to …
-
… accounted for the largest/smallest share.
-
There was a significant increase in …
-
The figures for … remained almost unchanged.
-
Compared to …, … showed a noticeable rise/decline.
3. Các lỗi thường gặp khi viết Pie Chart
❌ Đưa ý kiến cá nhân → ✔️ Chỉ miêu tả khách quan.
❌ Dùng sai thì (hiện tại thay vì quá khứ) → ✔️ Kiểm tra kỹ năm trong đề.
❌ Thiếu Overview → ✔️ Luôn viết Overview rõ ràng.
❌ Lặp từ percentage → ✔️ Luân phiên dùng proportion, share, figure.
4. Bài mẫu IELTS Writing Task 1 – Pie Chart
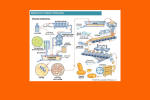
Đề bài: The pie charts below show the spending of a school in the UK from 1981 to 2001
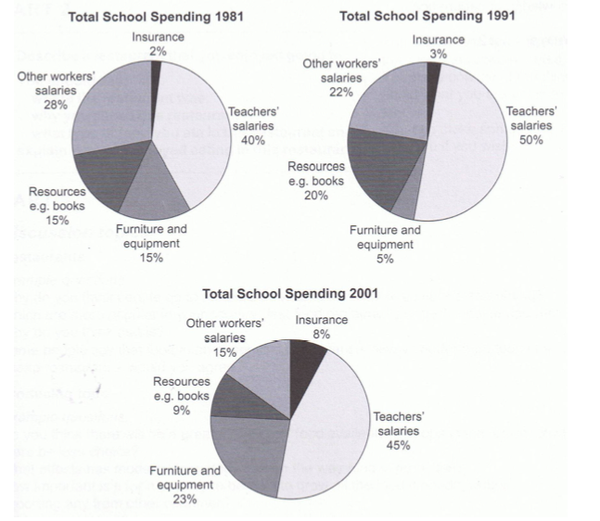
Introduction
The pie charts detail the fund allocation of a specific UK school across three different years: 1981, 1991, and 2001.
Overview
Overall, the bulk of the school's expenditure was consistently directed towards staff salaries. It is also noticeable that insurance costs experienced the most significant increase over the observed period, whereas there was a substantial proportional decrease in spending on learning and teaching resources.
Body 1
In terms of employee salaries, they accounted for approximately 70% of the total expenditure in the first two years and dropped to 60% in 2001. Initially, teachers' salaries represented 40% of the overall budget, outpacing other staff expenses at 28%. By 1991, despite a decline in other staff costs to 22%, teachers' salaries had increased by 10%, resulting in a net 4% rise in total salary expenditure. However, 2001 marked a notable decrease, with teachers' and other staff salaries being reduced to 45% and 15%, respectively.
Body 2
Turning to the other expenditure categories, insurance, albeit initially the smallest budget item, saw the most substantial growth, quadrupling from 2% to 8% over the years. Both resources like books and furniture/equipment started with equal allocations at 15% each. By 1991, spending on the former had risen by 5%, whereas the latter's expenses had decreased dramatically to just 5%. However, by the end of the period, the school had significantly reallocated its budget, boosting furniture and equipment funding to 23%, offset by an 11% reduction in resources expenditure.
5. Mẹo làm bài Pie Chart hiệu quả
-
Không cần nêu mọi con số → tập trung vào xu hướng lớn.
-
So sánh thông minh → nhấn mạnh cái “tăng nhanh nhất”, “giảm nhiều nhất”.
-
Paraphrase linh hoạt → thay vì the chart shows hãy dùng illustrates, compares, provides information about.
-
Đừng bỏ qua Overview → thiếu là trừ điểm Task Achievement ngay.
6. Kết luận
Dạng IELTS Writing Task 1 Pie Chart là một trong những dạng “dễ ăn điểm” nhất nếu bạn:
-
Paraphrase mượt mở bài.
-
Viết Overview nêu bật xu hướng.
-
Chọn lọc số liệu tiêu biểu để phân tích.
-
Dùng từ vựng học thuật, tránh lặp.
📍 THAM GIA Group trao đổi thông tin liên quan để cập nhật tình hình hỗ trợ các ngày thi:
https://www.facebook.com/groups/973836027775088
📍 Group dự đoán đề ielts, nhận tài liệu free: https://zalo.me/g/nyurbo095
Tài liệu dự đoán ib za.lo: 0931.369.966